Attribution is hard.
So you’ve probably tried to ignore attribution for as long as you could. (I know I have.)
But there comes a time when you can’t ignore it anymore. And at that moment it will morph from a headache into a very valuable tool.
The right time to look at attribution models is when growth has stalled on your marketing investments.
Sales are coming in, but it’s hard to justify spending more on Google Ads while maintaining your preferred ROAS/ROI.
This is the most common situation I see with my consulting clients.
To break out of this situation, you need to learn how your marketing efforts interact with one another and how each one contributes to sales. This will reveal what you should do more of, and what to cut back on.
The good news is that Google Analytics already has a lot of built-in reports for this, so you won’t need any new tools.
The bad news is that it’s going to take a while to figure this thing out. This article is just the start.
Attribution also is a really dry subject. So my goal with this article is to use a lot of examples to show you the practical implications of getting smarter about attribution.
I don’t expect you to get through the article in one sitting and implement everything straight away.
That’s why I’ve divided this article into 3 different levels. My suggestion is to start with level 1, master that and work your way up from there.
Here is what we’ll cover:
- Level 0 – Your “default attribution” is broken
- Level 1 – Starting with multi-channel attribution
- Level 2 – Google Analytics Attribution Models
- Level 3 – Custom model attribution (Ninja)
- Attribution Models in Google Ads
Level 0 – Your “default attribution” is broken
You’ve probably been using a form of attribution for a long time without realizing it.
That’s because all standard reports in Google Analytics use the last (non-direct) click attribution model.
What is last-click attribution?
It means that the last click before the conversion gets all the credit for that conversion.
Example: if a user clicks on a Google Search ad, comes to your site and buys, that Google Search campaign gets 100% of the credit.
Sounds pretty good right, not much to argue about.
But what if that customer first found you via an organic search result and then later converted through a Search ad.
Which channel should get the credit? Organic search? That paid search campaign? Both?
In the standard Google Analytics reports, paid search gets 100% of the credit for that sale.
This doesn’t represent the actual reality.
So whether you knew it or not, you were looking at skewed reports.
Purple Mattresses, for example, uses YouTube Ads to drive searches for their brand.
But if they were using this last click attribution model to evaluate the effectiveness of their YouTube Ads campaigns, they would probably stop running the ads.
Few customers click and convert right from that ad (especially for a +$1000 product). Most of them watch the ad and search for the brand at a later point in time.
So in their default Google Analytics reports, these YouTube campaigns would get almost no sales and the branded paid (and organic) search would get all the credit. The problem is those reports don’t explain WHY people were searching in the first place.
Being able to broaden their perspective allowed them to get this insight and invest more in YouTube Ads.
The same can happen to you. Once you see what’s really driving the results, you’ll be able to make better decisions.
Level 1 – Starting with multi-channel attribution
In what follows we’ll be talking about multi-channel attribution.
This means figuring out how different marketing channels interact with one another, and how to assign the proper credit to one for its part in the conversion.
This section of Google Analytics is different from all of the other reports you’ll find in it. That’s because of the difference in attribution models.
Here is the overview section of the Multi-Channel Funnels report in Google Analytics shows this:
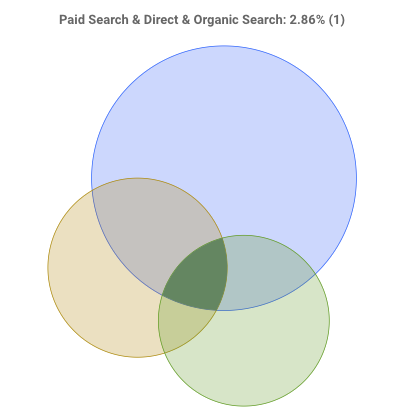
This Venn diagram shows how much channels contribute and intersect.
Find this report in your Google Analytics account:
Conversions > Multi-Channel Funnels > Overview
Report 1 – Path Length report
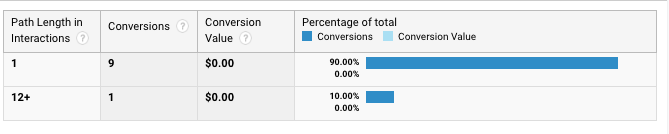
To see how complex your buyer’s journey is, take a look at the Path Length report:
Find this report in your Google Analytics account:
Conversions > Multi-Channel Funnels > Path Length.
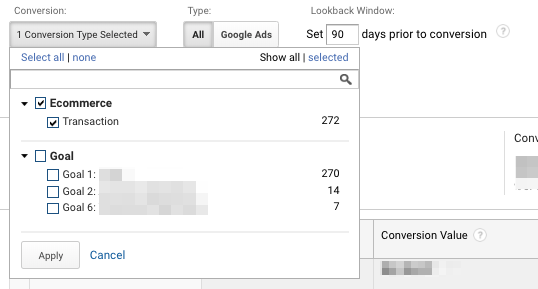
Make sure you only select a single goal for this analysis. It doesn’t make sense to mix Transactions with Newsletter subscriptions since these visitors are at different points in their buying cycle.
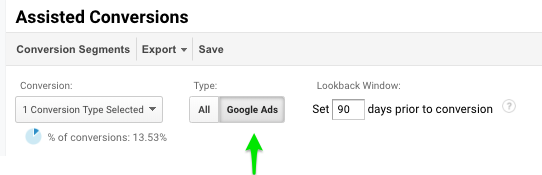
You can select the goal you want to use in the dropdown below “Conversion”:
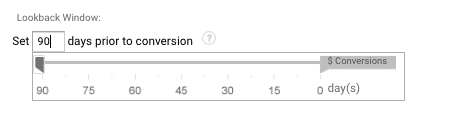
Also, set the lookback window to 90 days. We’ll get to the why behind this later.
The Path Length report shows you how many paths (or interactions or sessions) people have before converting.
In the account above, you can see that most (9 out of 10), visitors convert on their first interaction.
It’s a pretty simple interaction: people come to the site and they either convert or they don’t.
But if you’re running a bigger business, your report will probably look more like this:
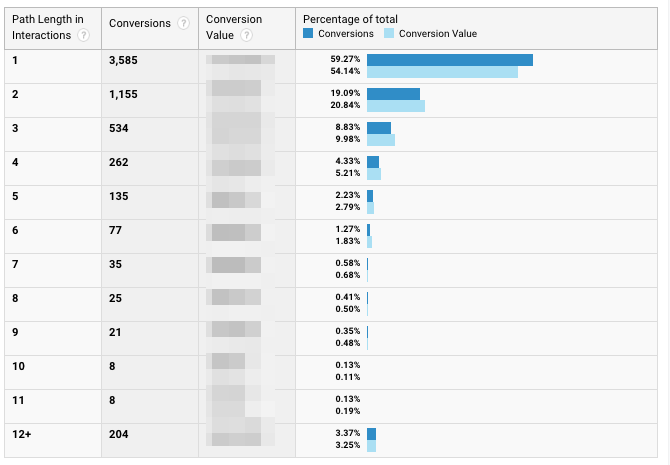
3585 sales, about 60% happen on the first visit. 19% of the sales happen on the second visit. And almost for 4% of sales, visitors came back 10 or more times before they purchased.
This report gives you a first glance at how complex your buying cycle is.
To understand which channels are driving these interactions (or clicks), let’s look at the Assisted Conversions report.
Report 2 – The Assisted Conversions report
Find this report in your Google Analytics account:
Conversions > Multi-Channel Funnels > Assisted Conversions.
The assisted conversions report shows all of the conversions that a channel assisted in, besides the last click conversions.
Example 1: someone searches on Google, clicks on a search ad, comes back later through an organic result, “Paid Search” gets the assisted conversion.
But here is where the report gets harder to read.
Example 2: someone searches on Google, clicks on an ad, comes back later through a different search ad, “Paid Search” gets the assisted conversion AND the last click conversion.
So there is a lot of double counting in the report above, easily overstating the impact of certain channels.
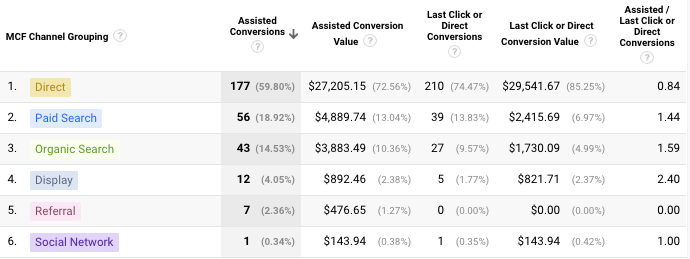
The advertiser in the report above generated $34,653.10 in revenue during that time frame.
But if we add up all the Assisted Conversions, we get a total of $37,497.43, a 7 percent difference.
One of the most interesting metrics in this report is the last column: Assisted/Last Click or Direct Conversions. The higher that value, the more a particular campaign assists with other conversions. So the 1.44 of Paid search means that for every last click sale, it assisted with 1.44 additional sales.
The report also offers a more detailed view of the assisted conversions of your Google Ads campaigns:
If we compare the assisted values in this report compared to the previous one, the differences become even bigger.
Total assisted value from Paid search is $4,889.64. But if we add up the assisted conversion values in this report shows a total of $6,640.43. That’s a 35% difference!
This brings up an important point about these reports in Google Analytics.
Google Analytics is free because Google monetizes through Google Ads. If they show advertiser positive things about their Google Ads campaigns, these advertisers spend more money.
So like I advocate a healthy distrust Greedy Google with your Google Ads campaigns, the same caution is warranted with this report.
That doesn’t mean that the report is complete garbage though. Especially in combination with the Top Conversion Paths report, it provides good value.
Report 3 – Top Conversion Paths report
This report looks like this:
Find this report in your Google Analytics account:
Conversions > Multi-Channel Funnels > Top Conversion Paths
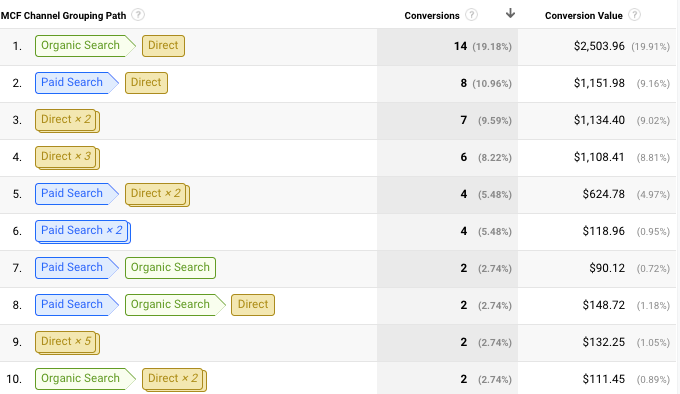
You can see the most common conversion paths that people take.
In this account, 14 sales came from visitors that first came from organic search, then came back directly and converted.
Rather than the raw numbers of assisted vs direct, this gives you a little more backstory as to which channels are helping in the assist.
As a business owner, you often think you know how visitors convert. This report is often as confusing as it is eye-opening.
Side note: In the screenshot above, you see a lot of Direct. This often happens and can indicate a data quality problem. Direct traffic is a mixed bag: untagged email campaigns, advertising, site redirect issues, etc. So if you see this in your account, make sure your external links are tagged with UTM parameters.
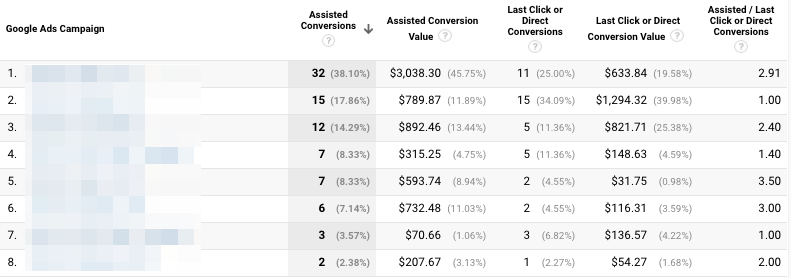
If we switch this report to Google Ads only, we can see the interactions between campaigns:
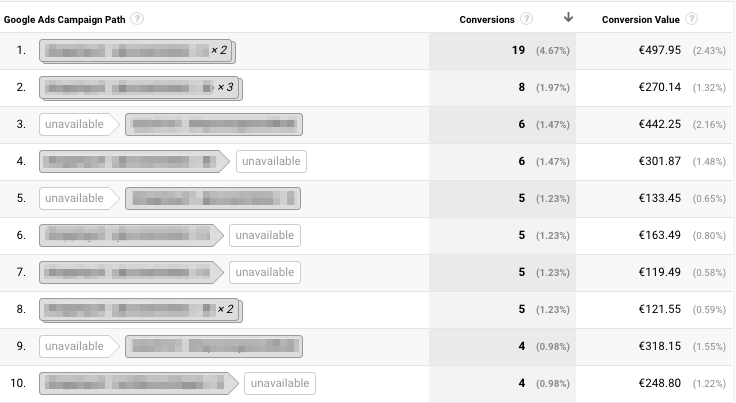
The blurred boxes are the actual campaign names. It’s interesting to see that the most popular paths are the ones were a visitor hits the same Google Shopping campaign 2 or 3 times before they purchase.
In that case, it makes sense to dig a little deeper and go to the ad group level to look at the actual sequence.
When there are interactions between different campaigns and different channels (marked as “unavailable” in this report), things get interesting.
Especially in cases where the Google Ads campaigns are the first interaction. Because if we’re only using last-click attribution, we’re likely to miss these conversions.
If I take a look at the actual campaign that’s mentioned on line 4, I don’t see a lot of direct sales, but the campaign is responsible for being the first click for 6 sales.
Now you already know how many visits it took for a user to convert and which channels drove those visits.
But how long does this process actually take?
For that Google Analytics has the Time Lag report.
Report 4 – Time Lag report
Are visitors in researching mode hitting your site 3-4 times in the same day before converting?
Or do they discover your site through some top of the funnel blog post, sign up for your newsletter and convert 12 days later via email?
Here is an example of a time lag report:
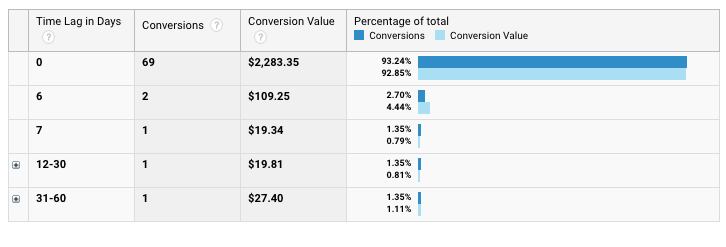
Find this report in your Google Analytics account:
Conversions > Multi-Channel Funnels > Time Lag
The screenshot above shows a business that makes almost all of its sales on the first visit (Time Lag in Days = 0).
This might seem like a very strong business: very motivated buyers that are eager to convert!
But like most reports in this article, none of them says anything whether a metric is good or bad, they just report what has happened in the past.
For the store from the screenshot, things aren’t going well. The site is suffering from a lot of conversion problems. And the few sales it manages to make are more down to luck instead of actual strategy.
One visit isn’t enough to build enough trust to make a sale. So this business would really benefit from finding ways to bring people back to the website.
Here is the Time Lag report for a different store:
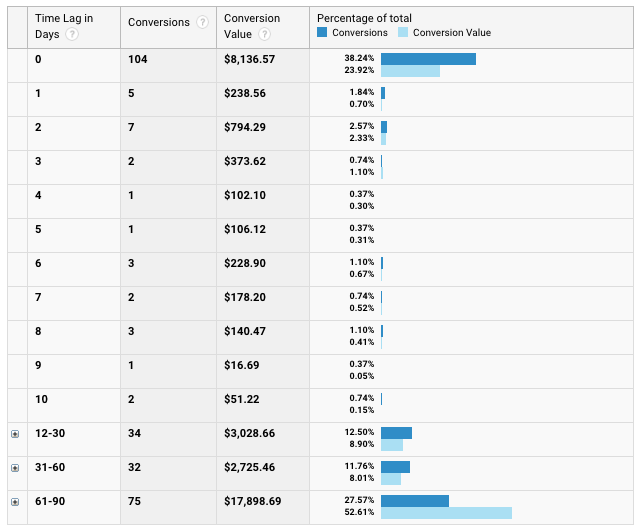
38% of the sales of this store come in on Day 0, then sales taper off but they never really stop.
Those blocks on day 12-30 are there because it’s simply the sum of those days. (The limit of the report is 90 days, so there is a big last block, summarizing all sales that come in from day 61 and beyond)
Drilling further down into the report reveals that sales keep coming in around 0.75% / day.
This means that we should be taking a long term view for this store. If we pay to bring visitors to the website today, we won’t see the total 90 days or even longer.
That could indicate a few things. And if we look at this report together with the path length, a couple of insights can emerge:
- Long time lag with high path length: visitors need to build up confidence in the brand before they’re ready to convert.
- Long time lag with short path length: visitors come to the site, forget about it and make a purchase when they rediscover it.
This gives us actionable information. If we have trust issues, can we survey visitors to find out what’s holding them back?
If people forget about the store, can we do something to be more memorable? Stay top of mind? Launch a remarketing campaign, use RLSA more aggressively, develop an email nurturing program, etc.
This wraps up the different attribution reports. They all give a slightly different perspective.
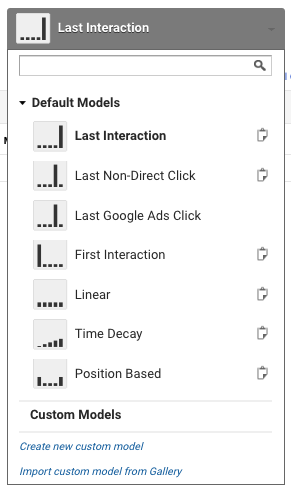
Now it’s time to look at the attribution models in Google Analytics. Their goal is to tie these different reports together in a couple of pre-packaged ways.
Level 2 – Google Analytics Attribution Models
The Multi-Channel Funnel reports we looked in the previous section are a “light version” to look at attribution.
If you’ve looked at those reports and are still a bit confused, don’t worry.
As I said starting out, attribution is hard. And that’s because the reality is a lot messier than you imagine, especially if you’re trying to cram a complex thing in a nice and pretty graph.
In this section, we’ll take it to the next level and look at the attribution models in Google Analytics.
The easiest way to get into them is just to use an example and apply the different models to it to see how that changes the dynamic.

Let’s take the following conversion path which resulted in a $200 order:
Last interaction attribution model
What: the last interaction (or click) gets all of the credit
Example: Paid Search gets $200 of the credit.
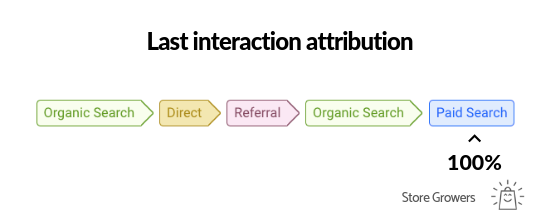
While there are 4 other visits from other sources, they get none of the credit.
That’s the main downside of the last click attribution model, it gives insufficient credit to the channels that drive top and middle of the funnel traffic.
When to use: It was ok to use before you discovered this article. But if you’re serious about making attribution work, you have to look beyond.
Last Non-direct interaction attribution model
What: the last non-direct click will get all the credit.
Example: Paid Search gets 100% of the credit: $200
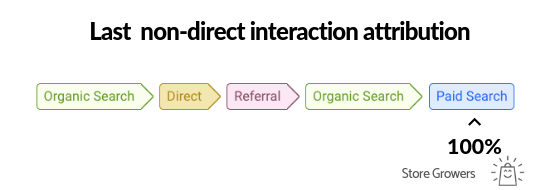
When to use: Google Analytics uses the Last Non-direct interaction attribution model as default.
This attribution model is even more flawed than the last interaction one. It’s already in all of the standard reports in Google Analytics, so avoid it when you’ve gotten this far.
Last Google Ads interaction attribution model
What: the last Google Ads click gets all the credit
When to use: Never.
This attribution model has exactly one reason of existence: be overly positive about Google Ads. It’s so bad I didn’t even bother creating a nice graph for it.
First interaction attribution model
What: the first click gets all the credit.
Example: Organic Search gets 100% of the credit: $200
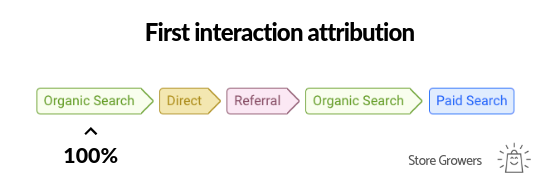
When to use: The first interaction attribution model suffers from the same flaw than the last click model. It takes a very narrow view of which channels to credit.
One thing it does is to unearth which channels or campaigns are at the top of the funnel.
But while important from an awareness perspective, visitors from these channels weren’t motivated enough to convert immediately. So it is thanks to the work of the other marketing channels that a sale came out.
Linear attribution model
What: all the clicks that contribute to a conversion get equal credit.
Example: Organic Search, Direct, Referral, Organic Search & Paid Search each get 20% of the credit, $40 per channel.
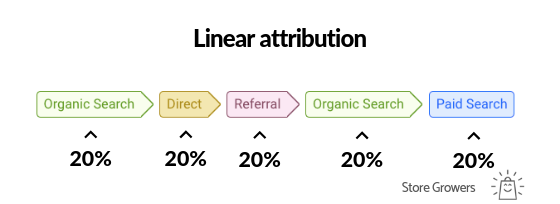
Note that because there are 2 sessions from Organic Search, it will get 40% of the credit.
When to use: The linear attribution model is already a step up from looking at the first or last clicks only.
Credit is equally divided up between channels.
And that’s the main drawback of this model. Because not all interactions have the same value for a business.
Let’s say you’re getting a lot of top of funnel organic search traffic from your content marketing efforts.
But most of your conversions come from your Paid Search campaigns.
In this case, both campaigns get equal credit. But without the paid search ad, that visitor wouldn’t have come back.
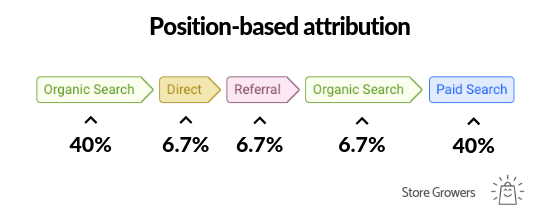
Position based attribution model
What: the first and last click each receive 40% of the credit and the remaining is split up across the other channels.
Example: Organic and Paid Search each receive 40% ($80), the other interactions receive 6.7% ($13.4).
When to use: This attribution model again spreads out the credit across the different channels, with the first and last click getting the majority of the credit.
While the linear model doesn’t discriminate between channels, the position-based model arbitrarily assigns credit to the different interactions. It might be a fit for some businesses, but for others, this particular split might not be ideal.
Time decay attribution model
What: every visit has a half-life of 7 days. So if a conversion happens 7 days after a visit, that visit will get half of the credit.
Example: Because of the half-life, timing matters in this attribution model so I’ve added a timeline.
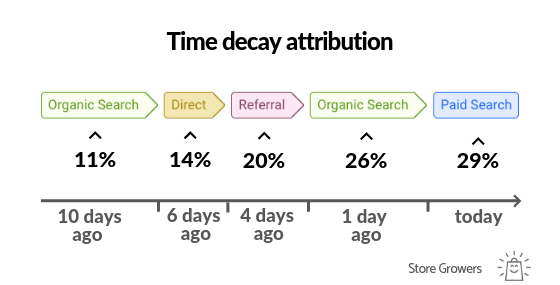
The actual math of this attribution is pretty tricky, but don’t worry, Google will do the actual calculations for you.
When to use it: this attribution model gives limited credit to visits early in the buying cycle and more to the interactions right before the conversion.
That’s why I like this one best.
Let’s see how the credit of a particular visit changes depending on the time decay:
- Credit for same day conversion: $100
- Credit after 7 days: $50
- After 14 days – $25
- After 21 days – $6.25
- After 28 days: $3.12
- After 35 days: $1.56
- After 42 days: $0.78
- After 49 days: $0.39
- After 56 days: $0.19
- After 63 days: $0.10
- After 70 days: $0.05
- After 77 days: $0.02
- After 84 days: $0.01
So after 84 days, a visit would get assigned $0.01 of credit.
That really doesn’t move the needle much when it comes to deciding how valuable a channel is or not.
My cut-off for the usefulness of the default time decay attribution model is around 30 days. If your time lag report indicates you have longer buying cycles, consider adjusting the half-life.
Testing Models with the Attribution Model Comparison Tools
After going through the Level 2 of attribution models, your head might be spinning a bit. That’s ok.
So let’s step away from the theory and look at how to apply this to your business.
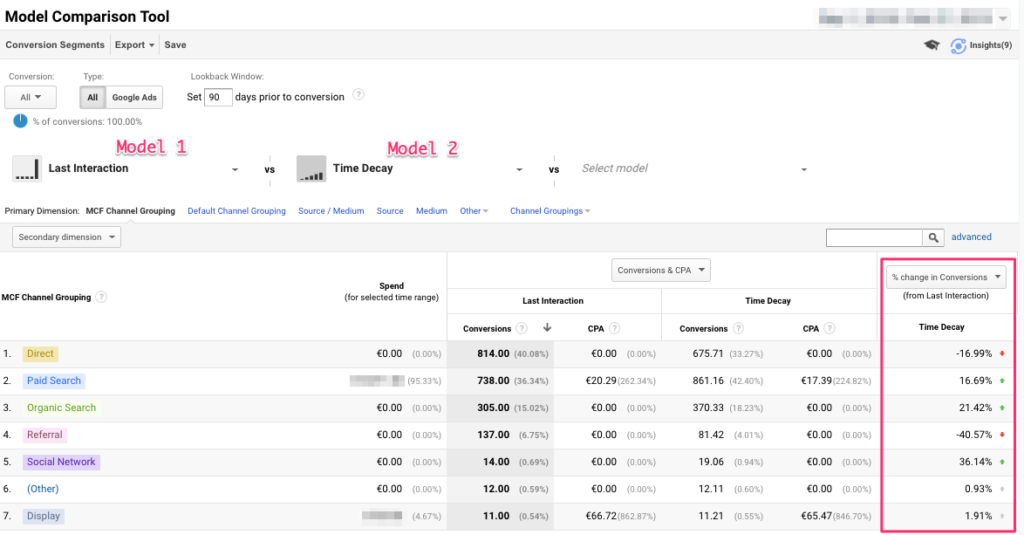
Google has a tool called the Attribution Model Comparison Tool. Here is what that looks like:
Find this report in your Google Analytics account:
Conversions > Attribution > Model Comparison Tool
Above the table, in the screenshot, you can select one of the attribution models in Google Analytics and see how the channel reporting changes based on the new model.
For this account, we see a 16.7% increase in conversions for Paid Search if we consider the time decay model compared to the last click attribution model.
I would suggest playing with the different models. With a specific attribution model in place, would you take different decisions?
Does it change anything about how you allocate budget?
In the case above, almost 17% difference might mean that you can be more aggressive on your paid search efforts.
That could mean increase the overall budget or increase your CPCs. This might help you get additional traffic and grow the business overall.
Give it enough time to play out. The time lag report I mentioned above shows your average buying cycle. If it takes 60 days for people to convert, make sure you test drive the changes based on your new attribution model for the same time frame.
But if you’ve followed the above, explored your numbers based on the time decay attribution model you can get even more specific.
Level 3 – Building a custom attribution model
Let me start out by saying that this section will be overkill for most people reading this blog.
But if you think you’ve mastered level 2, spend a ton on marketing and don’t have to convince your boss or client that they shouldn’t use last-click, you should have a look at this.
Instead of relying on someone else’s’ models, you want to create your own custom attribution model.
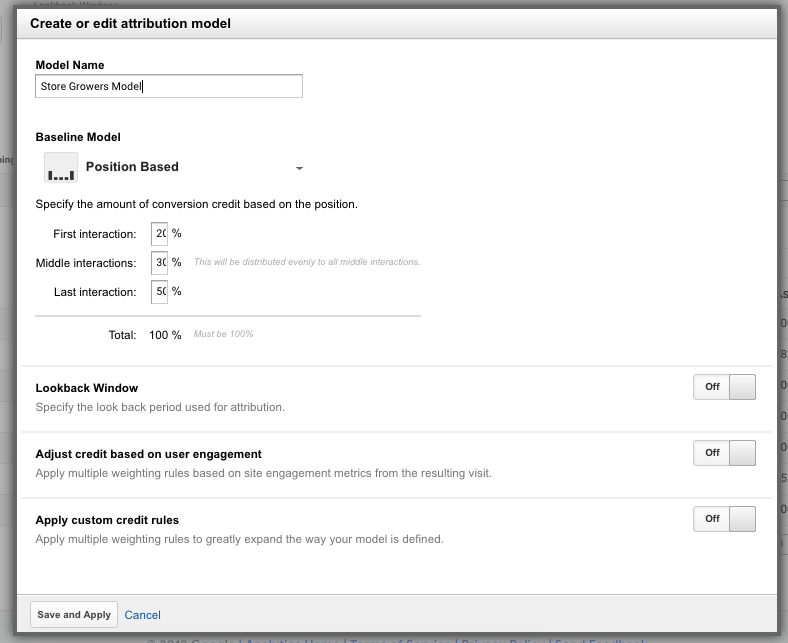
You can base it off one of the default models and customize every part of it.
To know what to customize it to you need to dig into your data and figure out your actual attribution.
For a great example on this, check out the excellent Avinash Kaushik article on these custom attribution models.
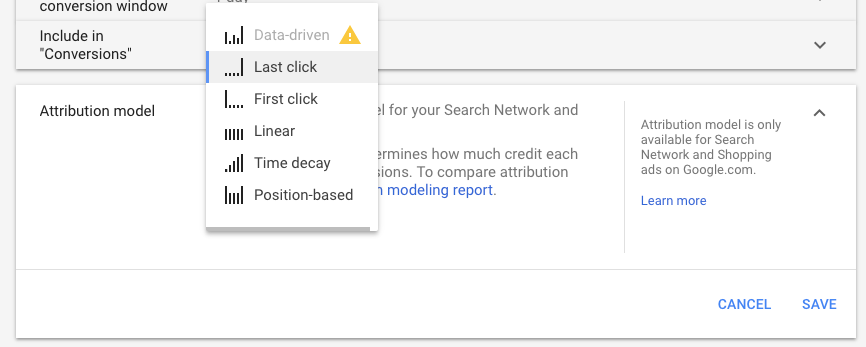
Attribution Models in Google Ads
So far in this article, I’ve only talked about attribution in Google Analytics.
You’ll see that much of the same reports and models are available in Google Ads.
Instead of showing the interplay between different marketing channels, it will show how your campaigns, ad groups, and products groups influence each other.
If Google Ads is your main source of traffic, you should run through the same report and see which information you can get from that.
This post is already very long so I’ll probably dive into this some other time.
But the most interesting part is the data-driven attribution model in Google Ads. For that Google uses your own conversion data to calculate the exact contribution of each click. That means no 2 data-driven models are identical.
Time for Action
If you’ve made it this far, congratulations! 😊
Don’t let all this effort go to waste and take action. Here is what to do:
- If you’re new to attribution: open up the Level 1 reports in your Google Analytics and get familiar with them.
- If you’re familiar with the Level 1 reports: go look at the attribution models in Google Analytics. See how your data change depending on the model
- If the default models can’t excite you anymore, start digging into your data to build your own custom model
Leave a comment on this post what you’re going to do next!

Great article, thanks – Was struggling to get my head around attribution reporting.
Glad to hear it was helpful Renji!
Hi Dennis,
thanks for the article, attribution is the stuff in analytics which i always find difficult to understand.
You’re definitely not the only one Doug, happy the article helps to clarify things.
thanks for the article! what i would like to know is, once i have compared, tested all of the models, and happy with one, can i change Google Analytics to use this model instead of the default Last Non-direct click and therefore see this change in all of my reports?
Hi Paul,
Unfortunately it isn’t possible to change the default Google Analytics attribution model to see the impact on other reports.
The reason for that is that Google Analytics uses a different data set for the Multi-Channel Funnel reports.
If you’re working with Google Ads, you can change the attribution model for all your reporting. Keep in mind that it won’t work retroactively, only from the moment you make the switch your attribution will be different.
Hope that helps!