The customer journey is an essential part of your sales process because it’s ultimately your sales funnel. Understanding the exact process that a customer undergoes when they are researching, deciding, and purchasing from you is critical to knowing which buttons you need to push along the way.
Today, customers are more fickle and demanding than ever before- and this is not a trend that’s going away anytime soon. Customers want personalization, and they want things to be relevant for them all the time.
Understanding and optimizing your customer journey means that you can offer customers more personalization and provide the right message, at the right time, to the right person.
And the best way to understand your customer journey, and how it relates to your checkout flow, is to rely on your pricing analytics.
The Customer Journey: Everything You Need to Know About Touchpoints
When working with the customer journey, it’s important not to go in blind.
This is where your data comes in: your analytics will show you exactly how your customers are behaving at each step between discovery and conversion.
The fact is, your ecommerce store’s KPIs hold each and every secret there is to the customer journey, and your strategy should be based on that data so you can track, measure, and evaluate your actions accordingly.
For example, touchpoints are crucial for the customer to build enough trust in your store and make an informed purchase decision.
A touchpoint is defined as an interaction with your brand in some fashion. On-site touchpoints would be what we can track directly on your site. Off-site touchpoints are the interactions that happen with your brand off of your site (think social media).
It’s rare that a customer would purchase on their very first visit with you. Most customers tend to bounce all over the place before deciding to purchase.
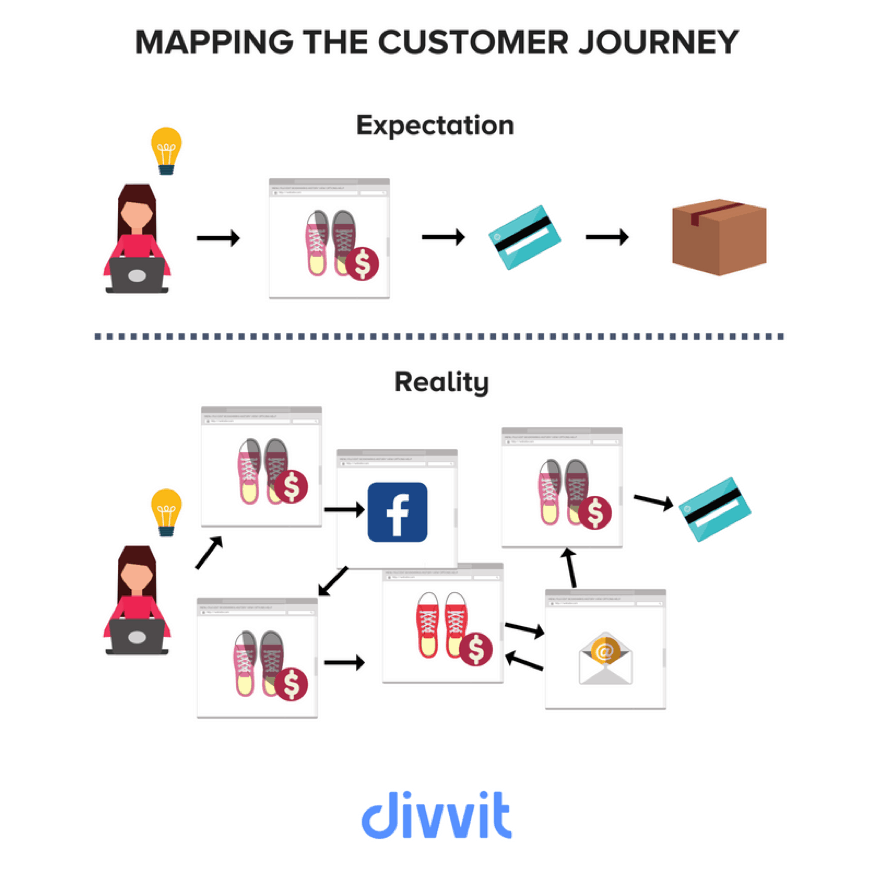
But this isn’t necessarily a bad thing- this is just the way the customer of today behaves.
Divvit counts 5.5 touchpoints needed on average between our merchants and their customers before a purchase can be made.
We’ve even seen as many as 20 touchpoints. Some customers need more convincing than others.
But what you need to understand is that each touchpoint is important because it’s an opportunity.
Whether the customer is interacting with your brand via Google AdWords, or one of your social accounts, or a banner ad on another site, each time they interact with your brand, they step a little closer to conversion.
In the customer journey, these touchpoints are going to fall into a few different phases as your customer’s attitudes and emotions develop. They’re in the process of deciding whether or not to purchase, and these touchpoints can be a great indicator of how likely they are to buy.
The Stages of the Customer Journey vs Your Ecommerce Checkout Flow
There are 3 main steps to the customer journey in ecommerce that we’re going to focus on today:
Awareness:
This is the moment when the customer first discovers you and your products. Usually upon the first click through to your site, they’re beginning to get a sense for who you are and what you have to offer.
Consideration:
During the consideration step, the customer is looking through your products and is starting to decide if they would like to purchase. This is typically one of the longer steps in the customer journey, as this is where all of those touchpoints happen.
The consideration phase is when you’ll start to see some customers make the shift between low intent to high intent. Low intent customers are window shopping, but they may not make a purchase at all.
The more engaged a customer is during this phase, the higher the likelihood that they will purchase, which makes them more high intent customers.
Acquisition:
This is the conversion we’ve been hoping for! The customer has made their decision and has decided to checkout.
From here, there are some other phases or steps towards reconversion, but that’s enough material for another article completely. We’ll focus on what we can track and measure for the first conversion.
So the customer journey seems pretty straight forward so far. But how does it stack up against your checkout flow?
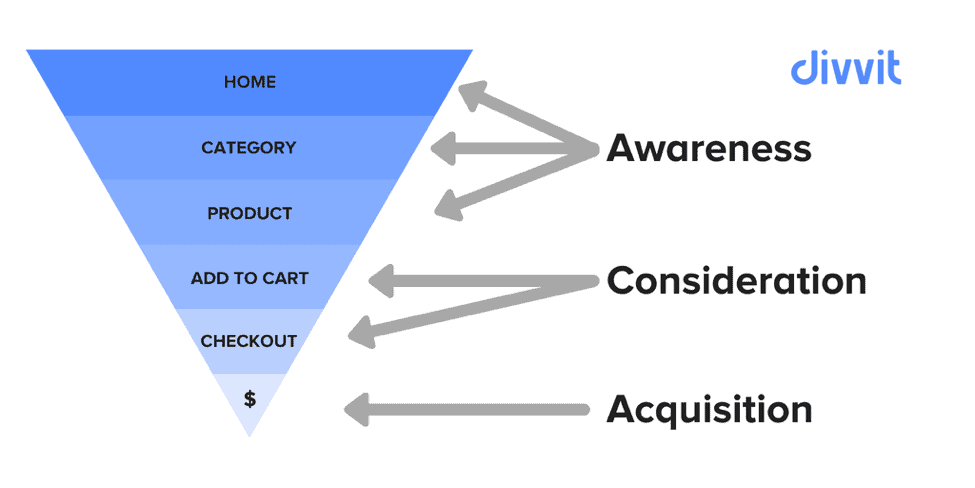
Following the same customer journey flow, we can see that your site structure is also built like a funnel, that narrows as a customer gets closer to conversion.
During the awareness phase of the customer journey, your customer is likely to be navigating through your homepage, category pages, and product pages. Typically, the longer that a customer spends on your site, the further through this journey they are.
When a customer adds a product to their cart, they’ve moved into the consideration phase, where the final decisions happen. They may even begin the checkout before really deciding if they’ll purchase or not.
As the customer navigates through your checkout flow and your customer journey, we can see behaviors from your data that indicate whether or not the customer is high intent or low intent.
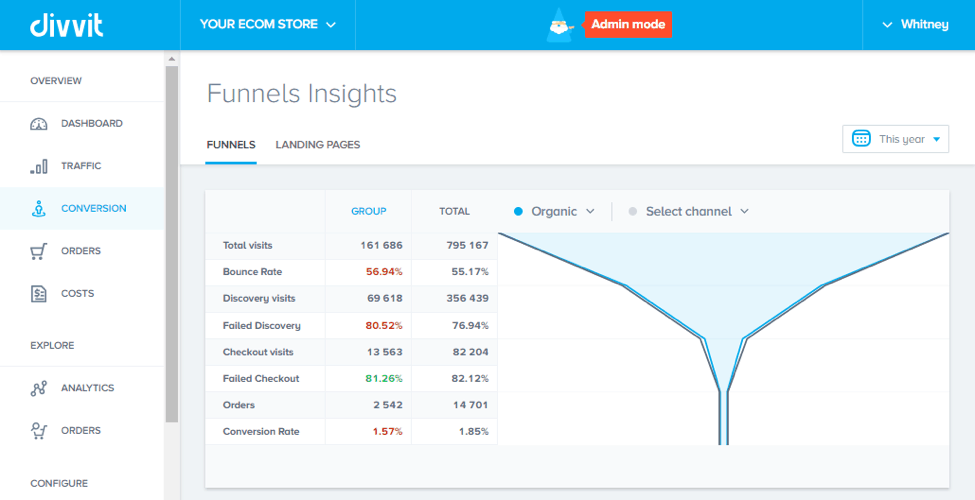
Looking at an actual sales funnel, we can see how this customer journey applies to your real checkout flow.
You should compare your conversion funnel by channel for the best idea on how the customer journey differs between channels (which you can see here compared between organic traffic and site-wide averages).
This also shows us the KPIs we should focus on to understand our customer journey.
What KPIs does the Customer Journey Affect?
The customer journey is all about two different things:
- Your UX and checkout flow
- The patterns of your customers’ behavior
When the two come together, this is where you find the customer journey. When it comes to mapping out the perfect customer journey, it’s important to keep a few KPIs in mind.
- Visits: how many people came to your site from this channel
- Pageviews/Visit: how many pages your customer viewed while on your site
- Average Visit Length: how long a customer spent on your site
- Bounce Rate: how many visitors left your site without navigating past the landing page
- Failed Discovery/Browse Abandonment Rate: how many visitors navigating through your site exited before adding anything to the cart
- Cart Abandonment Rate: how many customers added products to their carts but didn’t complete the purchase
- Conversion Rate: how many customers made it to the acquisition phase
These KPIs together form a basic customer behavior report. I always suggest breaking this down by channel- because customers coming in from different channels will behave differently and have different customer journeys.
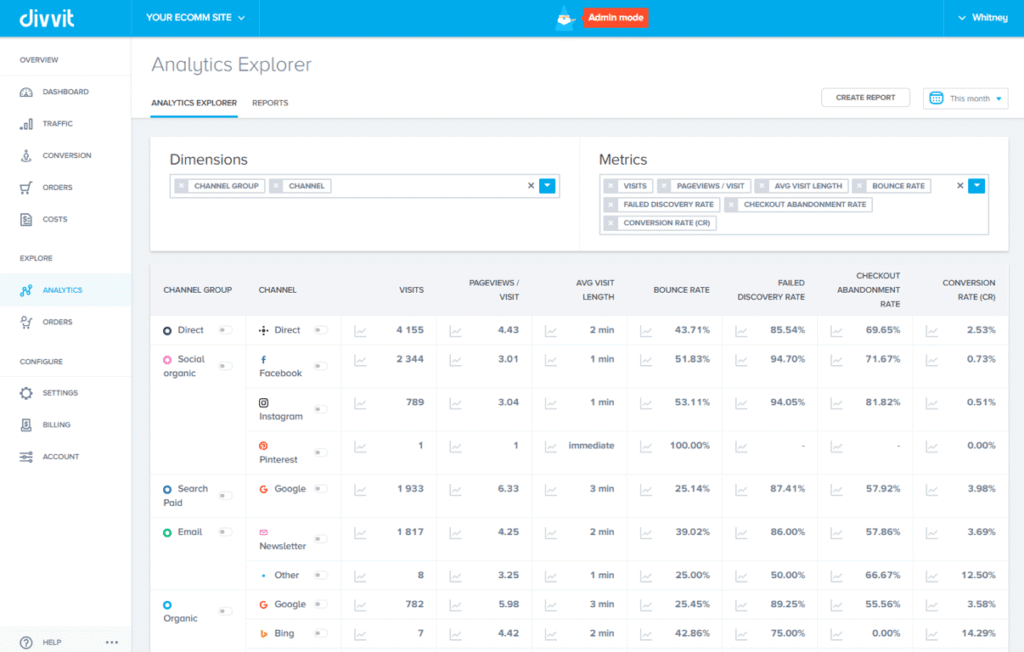
At first glance, these KPIs might seem a bit scary to look at all at once. But breaking it down bit by bit allows you to get a real understanding of how your UX is affecting your customer journey by channel.
What we can also see here is that organic Google is bringing in 782 visits this month, who have a relatively high pageviews/visit and average visit length.
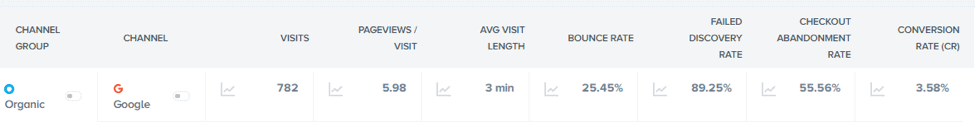
While it’s not bringing in a lot of traffic just yet, we can see that the traffic from Google is highly qualified. The bounce rate is lower than the typical 35% average, and the checkout abandonment rate is lower than the 70% average for ecommerce stores too.
Also, the conversion rate from this channel is fantastic: the average conversion rate for ecommerce stores is between 1-2%, and this channel offers a conversion rate of 3.58%.
This merchant has taken it further, as perhaps the SEO is still developing for this online store, so choosing to do AdWords campaigns is great for bringing in more of this high-quality traffic, with even better results:
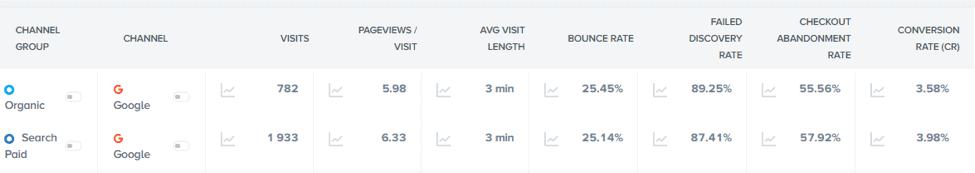
This is a great way to see whether your targeting is working for your online store. For these channels, we have a clear view that this is the right message, which is going out to the right customers.
The conversion rate reflects how successful these campaigns are.
Let’s take a look at a different example from the same store:

Here we have a snapshot of customer behavior over the past month for organic social channels Facebook and Instagram. Facebook is bringing in nearly 3 times the traffic that organic Google is, however we can see that this customer journey is completely different.
Pageviews per visit and average visit length is a lot lower than organic Google, and the bounce rate is twice as high. Even the checkout abandonment rate is at 71.67%, leaving us with an overall conversion rate of 0.73%.
Let’s break this down: organic Google is bringing in 28 orders for 782 visits, and organic Facebook is bringing in 17 orders for 2344 visits.
This is how you can start to see where the customer journey is different between your channels. Unlike organic Google, we can see that the customers coming in from Facebook are:
- Far less engaged (as seen in pageviews/visit and average visit length)
- They find the message less relevant (as seen in the bounce rate)
- They’re more likely to windowshop (as seen in a high failed discovery rate)
- They’re far less ready to purchase (as seen in the checkout abandonment and conversion rates).
This can definitely be a targeting issue, as the wrong targeting on social media could cause the trend in these KPIs. But it’s critical to make sure that we’re taking channel into account when we’re thinking about the customer journey.
Obviously, Facebook is working at driving traffic, but the channel isn’t bringing in the customers who want to buy. Or, your landing page isn’t providing the right message to those potential customers.
With that said, Facebook isn’t necessarily a total loss. This engagement still creates a touchpoint that we can examine for more information.
Understanding What Your Data Tells You About Your Customer Journey
Now that we’ve looked at the KPIs behind potential issues for an ecommerce customer journey, we’ve noticed an issue with organic Facebook.
Let’s examine it touchpoint-by-touchpoint to get a better sense of the value of this channel for your customers.

We can see that Facebook actually brings in quite a few touchpoints for your orders. While it may not always be the converting channel, it still works towards moving your customer in the right direction.
How far is it moving them towards conversion?

We can see here that Facebook ends up providing quite a bit of value towards the conversion of these customers. While some of the touchpoints are bounces or less than a minute in length, most of them are significant, with a higher number of page views.
What’s really interesting is that each of these touchpoints were completed on mobile or tablet. If there are more customers coming in from Facebook via mobile than they are via desktop, this can definitely account for some of the lower average visit times and pageviews.
Because mobile customers don’t act the same way as desktop customers, and their customer journey isn’t the same.
Now, we have all of this information at our disposal. Let’s sum up what we know about Facebook customers- as this is our channel to fix:
- Far less engaged
- They find the message less relevant
- They’re more likely to windowshop
- They’re far less ready to purchase
- Typically visiting through mobile or tablet
- They’re typically finishing their purchase via Google
Now that we know what the key issues are with this channel, we can begin looking at our customer journey and figuring out an action plan to fix these issues.
How to Create a Data-Driven Customer Journey Action Plan
When creating an action plan for your online store, it’s important to think about what kind of goals you want to achieve.
Anyone can say they want to make more revenue, but that doesn’t actually help you accomplish anything.
You need to define goals that make sense, and most importantly, they need to be measurable. Right now, we have a wealth of information at our fingertips: we know what KPIs we need to be concerned with, we know what channel to focus on, and we know what needs to be improved.
Time to set a tangible goal:
Bounce rate is likely the biggest issue for these Facebook customers- it’s twice as high as that of Google’s traffic, and this is the very first step in this customer journey we can start to fix. Because the journey can’t begin if your customers can’t get past your landing page.
For example, for a bounce rate that is at 51.72%, we should think about trying to drive that number down towards the 35% average for ecommerce stores.
You want your goal to be attainable: an unattainable goal will do absolutely nothing for you.
For our purposes, let’s say that over the next 6 months, we want to reduce the bounce rate by 15%. This helps us define:
- The KPI we’ll focus on
- The amount of change we need to achieve
- The timeframe in which to do it
This gives you something you can track and measure in your analytics. I mentioned earlier that you can’t go in blind- and setting goals for your ecommerce store’s customer journey is no exception.
Once you have a goal that you can work towards, you can start thinking about the different strategies that you can implement to drive this bounce rate down.
Keep track of your data throughout the timeframe that you’ve chosen.
Do check ups periodically, like weekly to see if there’s a difference in your bounce rate from check up to check up. Download weekly reports to track how your campaigns are performing in real time.
This will give you time to shift and wiggle your campaigns so you’re sure to make your goal. By regularly tracking and measuring your key KPIs, you should reach your realistic goals.
Key Takeaways
The customer journey is a complex subject, but understanding exactly how it functions in regards to your ecommerce sales funnel is critical to making sure your store is as optimized as possible.
Your data tells you everything you need to know about your site, your sales funnel, and your customers.
When you’re able to understand your data, you can think critically about what that data is telling you about your customer behavior and how they’re interacting with your store.
Once you understand that, you can continue to optimize the way your ecommerce store functions for better and better revenue over time.
What KPIs do you think are the most critical to the customer journey?
data

Customer experience requires a combination of traditional and modern approaches. You need not rely on what you knew when you started, you need to explore new routes that you can take to improve on how your business delivers in this aspect. Thanks for sharing what you know. I love how you added infographics in key places.