

Contributors
Data models can be powerful tools for many professionals, including marketers and analysts. They can help present a clearer picture of what tactics contribute most to overall performance. They can also help you better understand the live dynamics of how your efforts on different platforms affect each other. But what are data models, exactly?
Let's dive into what data modeling is, the data modeling process, and more.
What is a data model?
A data model is a visual representation of a conceptual framework that organizes and defines data elements and shows how they interact with each other. By mapping out data structures and their relationships in a visual format, it provides a method by which data is stored, organized, and retrieved.
Data models are critical in various fields, including computer science, data science, information systems, and business intelligence, among others. These models are integral to the process of designing databases, applications, and other systems that interact with data.
What are the different types of data models?
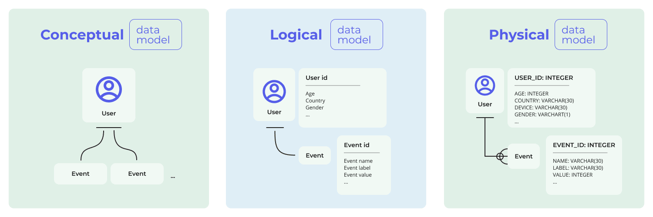
There are three types of data models that represent the different data modeling phases. For example:
-
A simple model to illustrate business concepts and workflows
-
A complex model to represent data entities and their attributes
-
An advanced model to represent both previous types, including the relationships and technical structures for data management.
These data models are usually created in sequential order as companies go from the planning phase to implementation.
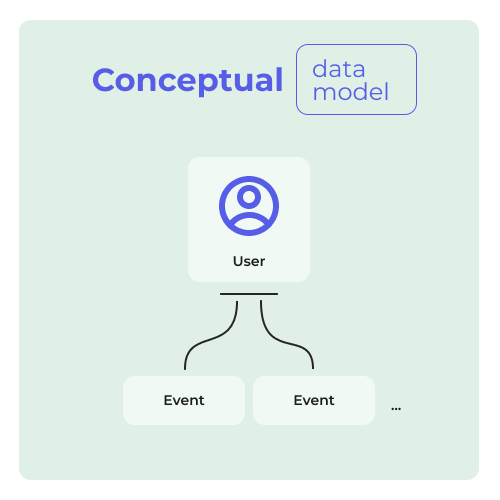
Conceptual data model
Conceptual data models are the most abstract form of a data model. They can be used to visualize the business or analytics operation that an application will support. Due to its simplicity, it is used by many stakeholders (especially business executives) to communicate ideas. Conceptual data models help business executives to see how the application would work and ensure that it meets the business needs without going into the details, such as data types or technologies.
Let's take Google Analytics 4 as an example of a data model.
Looking at the conceptual model for GA4, we can see the clear business need for a user data object to having one or more event objects. Since every interaction is captured as an event in GA4, this model clearly captures that.
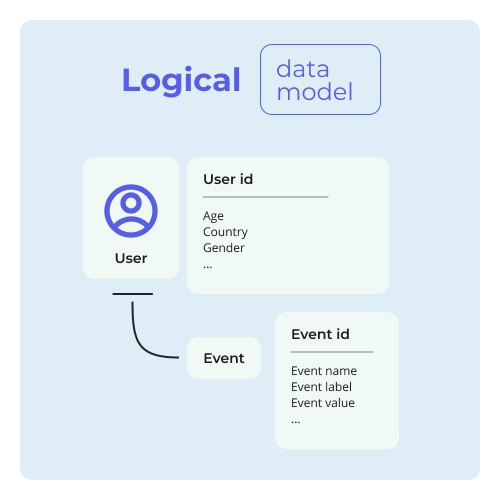
Logical data model
Logical data models take things a step further by adding more information. It works like this: logical data models show different datasets and describe their entities - including how they relate to each other. As they contains information such as data structures, keys, data types, and other characteristics, technical teams use logical data models to translate business requirements into application and database design.
Similar to the conceptual model, they are not connected to any technology.
Looking at the logical model for GA4, we can see what parameters are defined for each data object. The user data object is already configured, but you can choose up to 25 event parameters within each event.
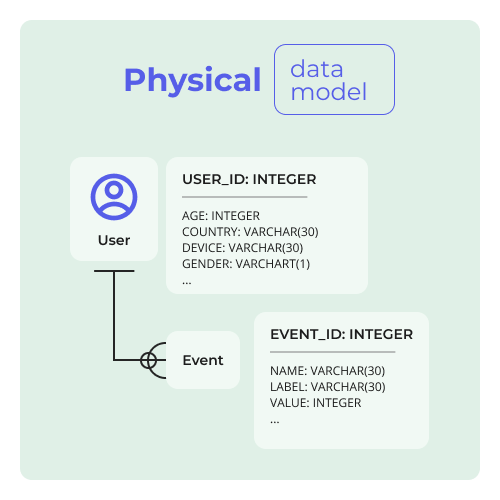
Physical data model
A logical data model is a building block for creating a physical data model that contains database-specific information about the data object, such as tables, columns, primary keys, and foreign keys. These models are specific to implementing a database system or application software. Database designers use this to generate scripts to create the database.
The physical model identifies the data types, the primary keys, and connections. In GA4, the user data object has a one-to-many relationship with the event data object, which means that a single user can have multiple events.
Why do we need data modeling?
Data modeling is a great tool to represent metrics and data in a business context, since it communicates requirements between business and technical teams.
By using visual representations, those who are responsible for defining the business needs can easily represent the datasets and their context. This helps identify what information is required to fulfil their business needs. Later, product teams can use this same model to further design a system by adding characteristics to these data elements. These elements will decide how they will be included in the application and how they will be processed, stored, and managed in a database.
A data model can be anything from a simple diagram to a visual showing complex connections between elements and their characteristics. The important point is that these models give data context.
What are some data modeling techniques?
Data models have existed since the 1960s when databases first became popular, but the techniques used to create these data models have evolved with time and technology. There are many different techniques with different pros and cons, and you should do thorough research to determine which method best suits your business needs.
Here, we will go through our three favorite techniques a data modeler might use:
Relational data modeling
The relational data model was created as a flexible alternative to its predecessor models. This model maps the relationships between data stored in two separate tables. The data will have rows and columns, where each row in a table can have one-to-one or one-to-multiple relationships with data in another table.
Relational modeling was the dominant modeling approach in the mid-1990s. It set the stage for developing relational databases and tools such as SQL (Structured Query Language) to access and manipulate data. We see the most common application of this approach in transaction systems like point-of-sales, banking, and websites.
Dimensional data modeling
Dimensional data models are designed to retrieve data quickly; hence, they see their primary use in data warehouses or data marts to support business intelligence. They consist of a fact table -- which holds all the information about transactions or other events -- and dimension tables, which hold data attributes from a fact table. Dimensional models in a data warehouse are designed to read, summarize, and analyze numeric information like values, balances, counts, and weights.
Two of the most popular types of dimensional data models are star schemas and snowflake schemas. Star schemas connect a fact table to different dimension tables, while snowflake schemas include multiple levels of dimension tables. Typical applications for these databases include building analytical data warehouses or data lakes.
Graph data modeling
The graph data model is a more advanced and modern data modeling technique. Used to describe the complex relationship between datasets, it's made of “nodes” and edges. A node represents where the data is stored, and the edge is the relation between nodes.
Some common use cases for this are social networks and recommendation engines. Technologies like Neo4j let you implement this easily using their native graph database platform.
Why should you care about data models?
Choosing the right data model for your business adds flexibility in expanding the features it can offer while eliminating data redundancy, reducing storage requirements, and enabling efficient data flow.
It helps to create a single source of truth, unlocking the ability to enhance your data collection and reporting capabilities.
Understanding the data model of the software your organization is using is also very important since it allows you to have better control and understanding of what data is being collected and how your organization can draw insights from it.
Data models in a business context
Data models can take into account a whole host of factors: how your customers interact with your marketing, how place factors in, how different events drive web traffic, etc. Essentially, data models can create a picture of how your business exists in the real world.
Let's take an easy example from Google Analytics 4 (GA4). A user interaction is called an event, and that event has parameters. By visualizing this data, we can better understand how the GA4 model views and records these interactions. From there, we can infer how these events in GA4 are represented in the performance of our marketing efforts.
Comparing the UA and GA4 data models
The “page view” and “events” are separate in the UA data model, reflected when we export the data from UA. Page view and each event have a separate data column (see the illustration on the left down below). Every time a new custom event is added, it introduces a new column to the data set, and the schema is affected.
When we compare that to the illustrations on the right for GA4, everything is an event, including the page views and all the custom events. Instead of having columns for each custom event, they are categorized under event parameters (such as event label/event name) into a single column. Event values/counts are also arranged into a single column unifying their values.
Anytime a new custom event is added to the tracking, instead of adding a new column to the dataset, a new row with a new event name is added, preserving the data schema.
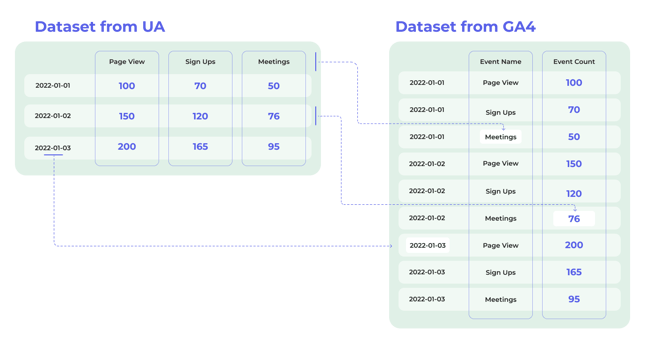
In the above image, you can see the UA data model on the left, which has different events as columns of data in a wide or pivoted format. In the GA4 example on the right, the same events shown in green as columns are transformed into rows of data. The values for these events shown in blue are consolidated into a single column.
Benefits of using a GA4 data model to store data
There are many differences (and advantages) between GA4 over UA. Still, let's look at some of the main differences concerning the data export and how this new data model unlocks some of the capabilities.
-
Allows data to be stored more densely, which makes the data easy to store while allowing easy transformations to other types. This data format is great for visualizations such as stacked graphs, funnel charts, and area charts.
-
Introducing new custom events does not change the data export model. No new columns are created, making adding or removing events easier without breaking the database model and data pipeline downstream.
-
The same parameter can also be used across multiple events, meaning parameters only need to be registered once, saving valuable quota space. You only get up to 25 event parameters in the free version.
-
Easy sequencing of events and page views together to create a custom funnel and pathing.
Understand what and how things get measured
We hope this article inspired you to learn more about data models and the data modeling process. Understanding data models will help you also understand data processing, and the interactions between different datasets generated by your business.
Even if you are not going to build a system, understanding the data model of your business's software is very important. It helps you to have better control over what gets measured and how.
To learn how to ensure that your data is clean as can be (and ready for the data model of your choice), check out this article about data cleaning.