

 In late April 2020, Google announced the expansion of the Surfaces across Google program in an effort to grow free organic traffic to advertisers’ sites. These “listings” replaced a portion of Shopping Ads’ real estate in the Google Shopping Tab and have now expanded to include local inventory free listings and the Knowledge Panel that usually appears on the right side of the main search results page.
As the program rolled out and we learned more about the opportunities it would provide, we wanted to get a better understanding of how it would impact Google Shopping. What type of click and transaction volume could a “free” program from Google could realistically drive?
Our early results analyses based on 30 days of performance were exciting, but the Free Listings program has evolved and grown since then. Now that we’re able to analyze accounts with more available information and metrics, we have a deeper understanding of the real impact of the addition of the program.
In this article, you’ll learn what the Free Listings program is, what we saw after one year of performance across 58 accounts, and thoughts from ROI’s Google experts on the impact of the program on what we call the Google Shopping Landscape (which is what we call the combination of Free Listings plus Paid Shopping).
What Are Free Listings and Where Do They Surface?
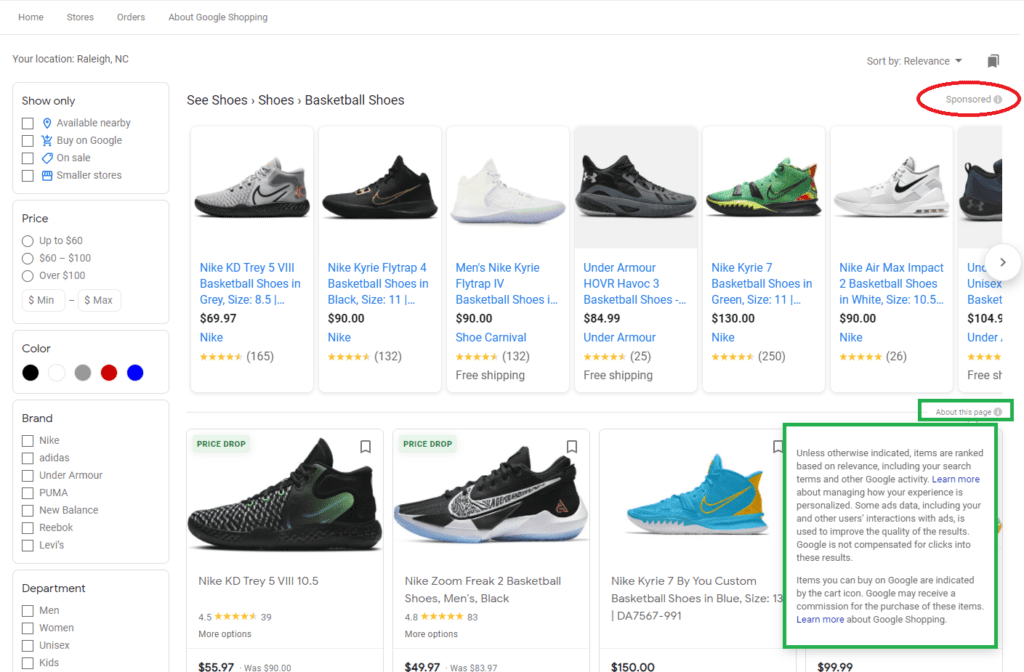
Free Listings originated under Surfaces across Google, a free, product-based program that originally rolled out in late 2019. It ramped up into what we see today with the April 2020 announcement that Surfaces across Google would appear in the Google Shopping tab and effectively “steal” some territory from standard paid Shopping Ads.
Sponsored Shopping ad placements still appear at the top of the Google Shopping Tab page in a scroller, but beneath those are the Free Listings and grouped Compare Stores listings that are unpaid!
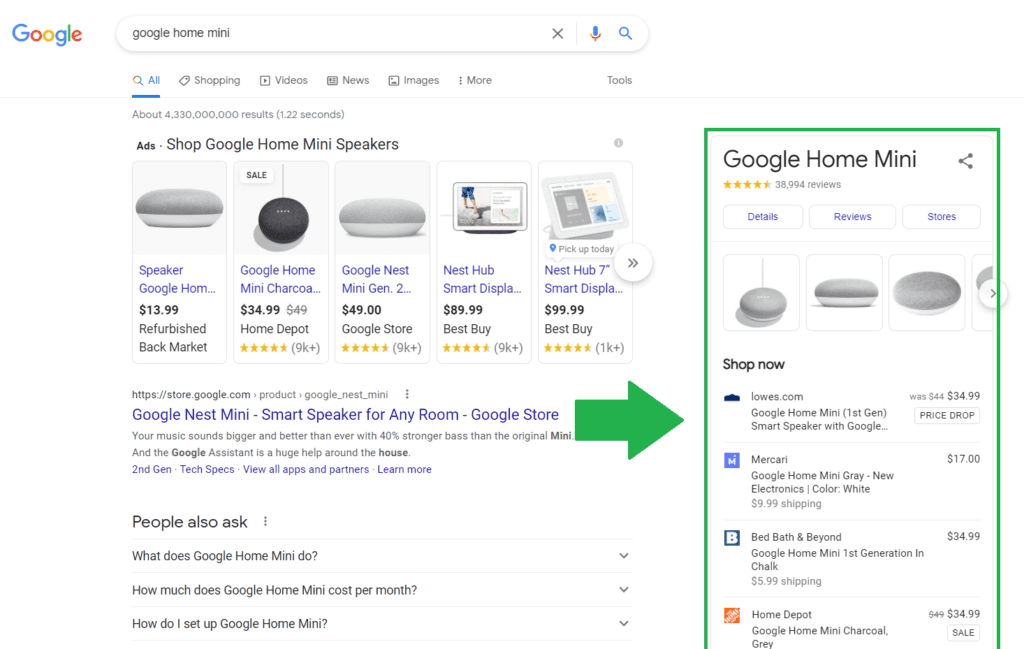
The Knowledge Panel on the primary search results page operates very similarly to the Compare Stores listings on the Google Shopping page. It functions by grouping items based on a common [gtin], [brand], and/or [mpn] value. Like the listings on the Shopping Tab, these placements used to be paid, but more recently have become free!
One Year of Performance: What Are the Trends?
For this analysis, we pulled performance data for the Free Listings and Paid Shopping programs of 58 accounts at 365 days since tracking was implemented. We recorded the following primary metrics:
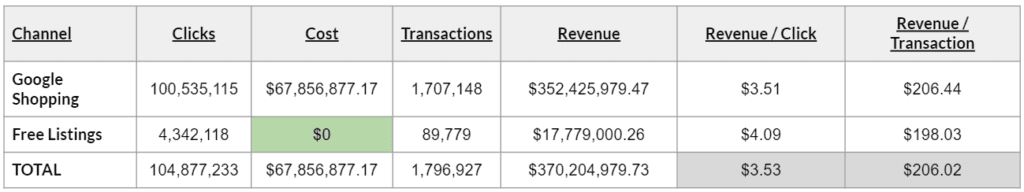 When evaluating the entire Google Shopping Landscape, Free Listings accounted for 4.14% of overall Shopping Landscape traffic. This metric is fairly consistent with the ~5% statistic that Google communicated back when the Shopping Tab was all paid.
Google Shopping Landscape: The combination of Free Listings plus Paid Shopping.
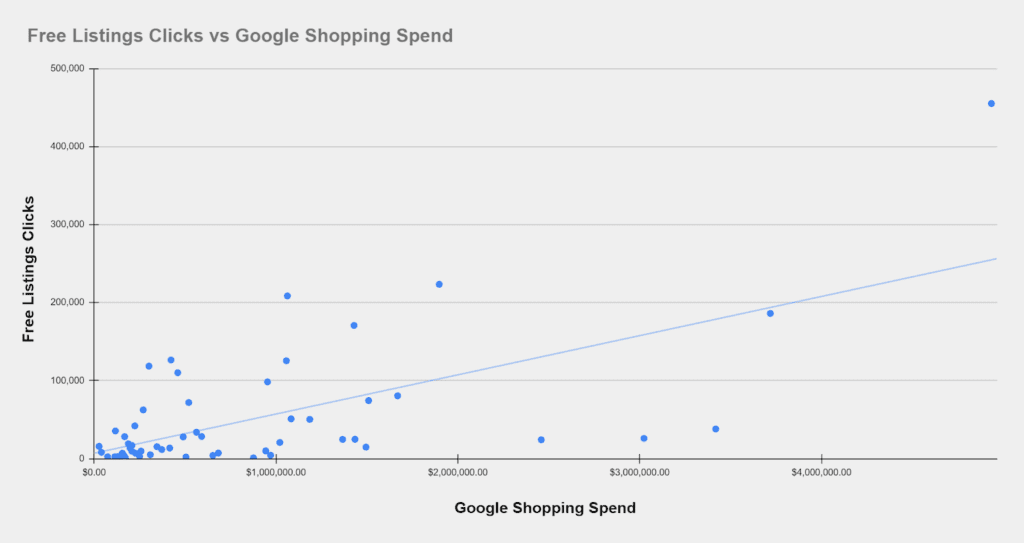
Like our previous analysis, we wanted to display the impact of Google Shopping Spend on Free Listings Clicks, as we found this to be the strongest positive relationship between metrics. The below chart displays that trend for these 58 domains.
 Intentionality to Purchase
 Intentionality to Purchase
As can be derived from the table shown above, the revenue per click metric is actually higher for Free Listings compared to Google Shopping, while revenue per transaction is lower. The conversion rate for Free Listings is also 18% higher at 2.07%, compared to 1.70% for paid Shopping ads.
These statistics lead us to believe that shoppers’ intentionality or readiness to purchase is a bit higher for Free Listings than paid search results page Shopping Ads.
To further expand upon intentionality to purchase, we evaluated CTR performance for a time period eight months past when Google introduced impressions as an available metric in the Google Merchant Center for the program (October 6-7, 2020).
We recorded the following for these 58 accounts from October 7, 2020 to May 6, 2021:
Impressions:
- Google Shopping: 6.98 billion
- Free Listings: 539 million
- Free Listings Percentage of Total Impressions: 7.2%
Clicks:
- Google Shopping: 58.8 million
- Free Listings: 2.8 million
- Free Listings Percentage of Total Clicks: 4.5%
CTR:
- Google Shopping: 0.84%
- Free Listings: 0.53%
On average, CTR is lower for Free Listings. But based on the metrics for revenue/click and conversion rate, the intentionality of that click is stronger.
While shoppers are comparing and viewing lots of different products, it’s more likely that they will find the exact product they want from the exact seller they want in the Shopping Tab and convert on the Free Listing.
Shoppers are scrolling and looking at lots of options on the Shopping Tab from multiple sellers and different variations, but once they find what they’re looking for, they’re more likely to make a purchase. It’s seemingly less of an interest click and more of a ready-to-purchase click.
Industry Analysis
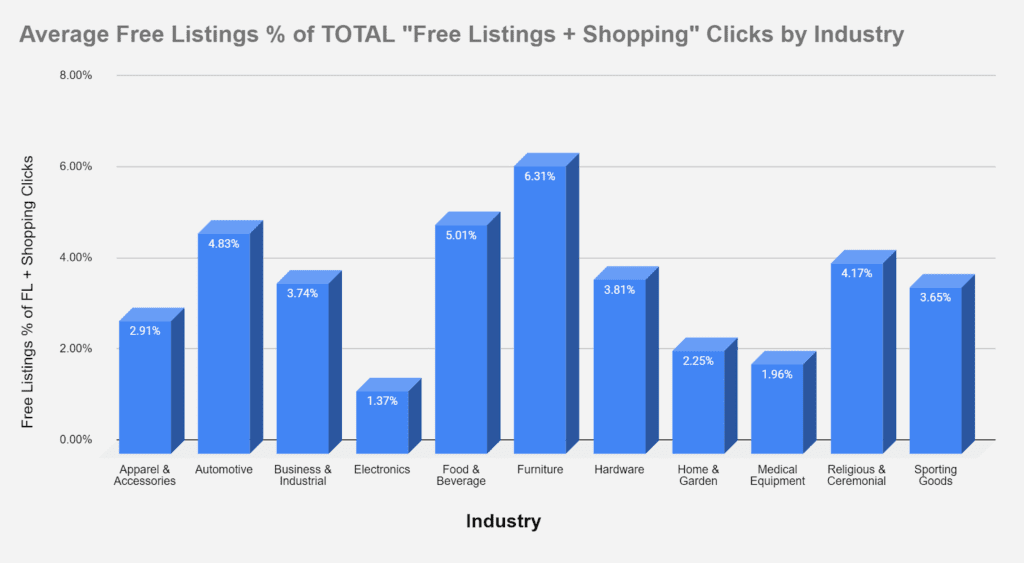
We also grouped all of the domains from this sample into general industry categories. Apparel & Accessories and Electronics clients seem to see the least impact on total traffic, while Furniture is seeing the largest impact. (Note: Home & Garden and Business & Industrial industries made up a large percentage of the total industries for this study.)
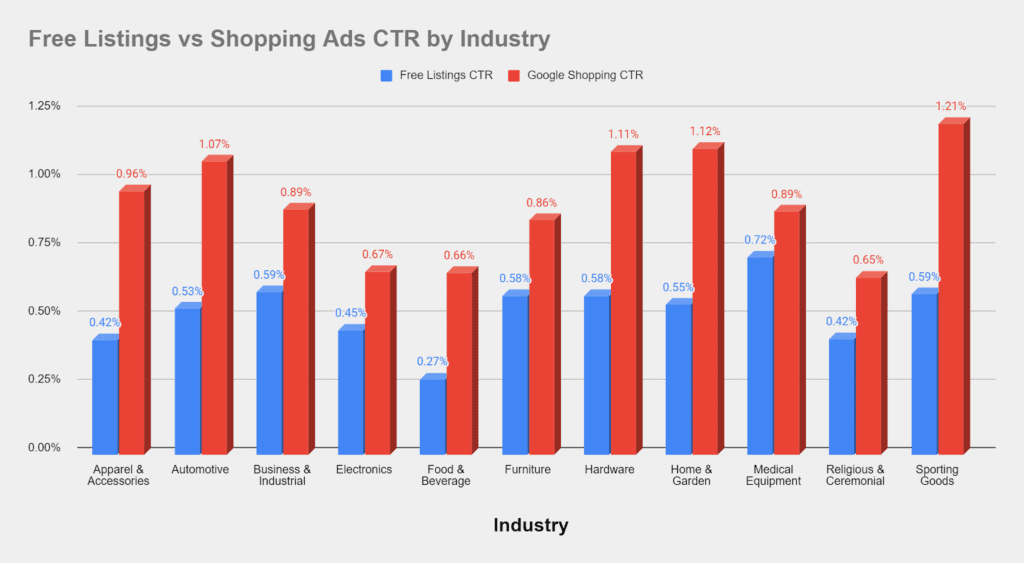
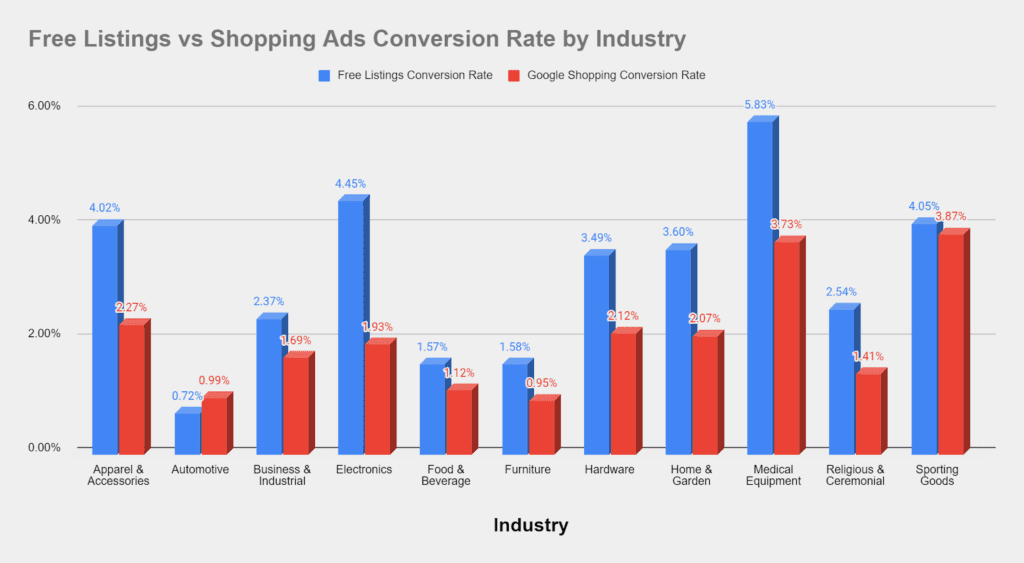
 We also compared click-through and conversion rates by industry, which told a slightly different story. As you can see, Medical Equipment maintained the strongest CTR while Medical Equipment and Electronics maintained the strongest conversion rates for Free Listings, somewhat antithetical to the total percentage of traffic trends above.
Understanding the Impact on the Google Shopping Landscape
 Understanding the Impact on the Google Shopping Landscape
Looking at overall metrics and trends for some of the accounts in our Product Feeds team’s portfolio is great, but it doesn’t quite tell the whole story.
 These feed-based free advertising placements have delivered nearly $18 million in revenue across nearly 60 domains – but what has been the real impact on these businesses’ Google Shopping Landscape performance?
As mentioned above, Shopping ads and Free Listings can surface in many places. We want to develop an understanding of how these programs work in tandem (or against each other).
We don’t have the entire deep dive analysis of year-over-year Shopping Landscape performance for all the clients in this sample group yet. However, through the account-specific analysis above as well as an in-depth look at the relationship between metrics covered in this blog post, we determined that Free Listings accounted for 3.5-5.3% of overall Shopping Landscape clicks and that Google Shopping spend has the strongest positive relationship with Free Listings clicks.
In a year-over-year comparison analysis for two clients looking at Google Shopping performance from May 2019-May 2020 and then Google Shopping Landscape performance from May 2020-May 2021, we noted the following:
- Value per $1 in Google Shopping spend increased by 1.9% on average, representing Google Shopping Ads growth over time.
- Total Google Shopping Landscape value per $1 in Shopping Ads spend increased by 7.8% on average.
- Free Listings added incremental revenue on top of the program and did not cannibalize Google Shopping Ads, as indicated by the metrics above.
Final Takeaways
The primary takeaway based on all of the data shown above is:
It helps to track and understand the performance of Free Listings!
For nearly every industry in the sample, Free Listings maintained a stronger conversion rate than Google Shopping ads and incrementally improved overall Google Shopping Landscape traffic and revenue volume.
With a completely unpaid program, you still want the ability to know the impact on your business! If you aren’t tracking your Free Listings traffic, look back at the guide in our previous Surfaces across Google article so you’ll be able to see how your revenue grows. You can also set up custom reports and dashboards to segment program traffic performance with specific metrics in the Google Merchant Center under Performance > Your reports.
While not discussed above, you can also set up Google Merchant Promotions specifically for Free Listings (just like with Google Shopping). Taking advantage of Merchant Promotions is a must during the holiday shopping season, so be sure to prepare for that in the coming months!
Free Listings are completely powered by your Google product feed. In addition to having high-quality feed data, taking advantage of content optimizations and important attributes in your data feed is critical. Be sure to check the Google Merchant Center for specific Free Listings diagnostics and product disapprovals and warnings, as well. Policies are slightly different for this program compared to regular Google Shopping!
Focusing on your product feeds may not be top-of-mind for your brand, but making sure they’re optimized can significantly boost your brand’s revenue, help you spend your ad budget more effectively, and more. Our proven digital experts can help you ensure your product feeds are in top shape and fix under-performing product lines. Connect with us today to see how we can help your brand.
Sources:
- ROI Revolution. “Surfaces Across Google: An Early Look at Unpaid Shopping Performance” https://roirevolution.com/blog/surfaces-across-google-an-early-look-at-unpaid-shopping-performance/
- The Keyword. “It’s Now Free to Sell on Google” https://blog.google/products/shopping/its-now-free-to-sell-on-google/
- ROI Revolution. “23 Holiday Shopping Season Tips for Ecommerce Marketers” https://roirevolution.com/blog/holiday-ecommerce/
- ROI Revolution. “The 2021 Ecommerce Holiday Success Plan for Brands” https://roirevolution.com/resources/white-papers/holiday-guide/?cmp_act_id=97bba6b5-db01-ec11-94ef-000d3a990684&utm_campaign=White%20Paper%3A%20The%202021%20Ecommerce%20Holiday%20Success%20Plan%20for%20Brands&utm_source=ROI%20Blog&utm_medium=Free%20Shopping%20Listings&utm_content=2021-08-24