US Inflation Trends And Outlook, 2024
In June 2022, inflation in the US reached a 40-year high. By December 2023, however, it had significantly decreased, per the latest data from the US Bureau of Labor Statistics (BLS). This decline can be attributed to several factors, such as US Federal Reserve interest rate hikes, supply chain efficiencies, and a decline in gasoline prices.
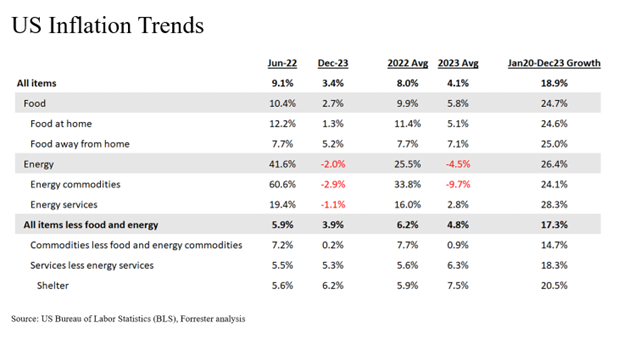
Even though inflation has come down, consumers are still feeling the pinch of higher prices. This is because the prices are up significantly compared to pre-pandemic. If we compare prices in December 2023 to January 2020, overall prices are up 19%, food prices are up 25%, energy prices are up 26%, and the prices of shelter services are up by 21% (see figure below).
Let us look at the trends in the various measures of inflation reported by the BLS:
- Headline inflation declined from 9.1% in June 2022 to 3.4% in December 2023. It refers to the overall increase in the average price level of all goods and services in an economy. The BLS refers to it as the “All Items” category. On an annual average basis, this is down from 8.0% in 2022 to 4.1% in 2023.
- Food inflation declined from 10.4% in June 2022 to 2.7% in December 2023. It refers to the increase in the average price of food over time. Within the food category, the BLS distinguishes between “food at home” and “food away from home.” The food at home category includes grocery store purchases, such as fruits, vegetables, dairy products, meat, and other essential food items. It declined from 12.2% in June 2022 to 1.3% in December 2023. The food away from home category consists of meals and snacks purchased at restaurants, cafes, and other food establishments. It has remained somewhat elevated. In December 2023, food away from home inflation was 5.2%.
- Energy inflation is down from 41.6% in June 2022 to -2.0% in December 2023. It is another important aspect of overall inflation, as energy costs significantly impact both households and businesses. The BLS classifies energy inflation into two main categories: energy commodities and energy services. Energy commodities include physical energy resources that are consumed, such as fuel oil, gasoline, diesel fuel, and other motor fuels. It declined from 60.6% in June 2022 to -2.9% in December 2023. Energy services include electricity and utility (piped) gas services. It declined from 19.4% in June 2022 to -1.1% in December 2023.
- Core inflation declined from 5.9% in June 2022 to 3.9% in December 2023. It is a measure of price changes for all items in the consumer price index except for food and energy. This exclusion is based on the idea that food and energy prices can be more volatile and subject to short-term fluctuations, which may not necessarily reflect the underlying inflationary pressures in the broader economy. The BLS refers to it as the “All items less food and energy” category.
- For goods inflation, the BLS reports inflation rates for various commodity categories, including “Commodities less food and energy commodities.” It decreased from 7.2% in June 2022 to 0.2% in December 2023. Subcategories include household furnishings and supplies (window and floor coverings, furniture, bedding, appliances, tools, housekeeping supplies), apparel (for men, women, and infants, as well as footwear and jewelry), transportation commodities less motor fuel (new vehicles, used cars, parts), medical care commodities (prescription and nonprescription drugs, equipment), recreation commodities (video/audio products, pets, sporting goods), education and communication commodities (books, computers, smartphones), alcoholic beverages, and other goods (tobacco, personal care products). All commodities saw a decline in inflation except medical care commodities (see figure below).
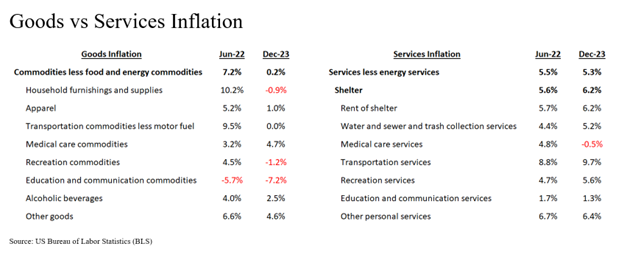
- For services inflation, the BLS reports inflation rates for various services categories, including “Services less energy services.” It remained elevated at 5.3% in December 2023. It has a “Shelter” subcategory, which is a catch-all category for all the services including rent of shelter, water and sewerage maintenance, garbage and trash collection, household operations, medical care services (hospital, insurance, professionals), transportation services (rental, maintenance, insurance, public), recreation services (video/audio, pet, movie/event tickets), education and communication services (tuition, telephone, internet), and other personal services (legal, financial, personal care, laundry, etc.). Shelter inflation has been stickier and remained elevated at 6.2% in December 2023.
Looking ahead into 2024, Forrester expects headline inflation to decrease from an average of 4.1% in 2023 to 2.6% in 2024. We expect that core inflation will decrease to 3.0% in 2024, primarily due to an expected decline in services inflation. These estimates are based on Forrester’s analysis of BLS inflation data and other macroeconomic indicators. We will continue to monitor BLS inflation data and provide periodic updates as more actual data becomes available.
In our upcoming report, US Consumer Spending Outlook, 2024, we discuss how key US macroeconomic trends will impact consumer spending in different categories during 2024. In that same report, we also explore the implications for B2C marketers and brand manufacturers. We are hosting a webinar on this topic for Forrester clients on February 12. If you are a Forrester client and would like to learn more, please schedule an inquiry or guidance session with Dipanjan Chatterjee or me!
Related Forrester Content
Categories