The abandoned cart benchmarks report: 2024 data to inform your strategy


Abandoned cart flows make you money—more than any other automated flow you set up.
That’s what Klaviyo’s product analytics team discovered when they analyzed over 143K abandoned cart flows sent in 2023 to gather data on abandoned cart open rates, click rates, revenue per recipient (RPR), and more.
In this report, we compare abandoned cart flow metrics for the average ecommerce brand to abandoned cart flow metrics for brands performing in the top 10% of Klaviyo users.
What you’ll find is that even a basic abandoned cart flow is worth your time and effort—but that investing in A/B testing and improving your abandoned cart engagement and conversion can pay off even more.
For an in-depth analysis of other flows and campaigns across email and SMS, download the 2024 Klaviyo Benchmark Report. Here, let’s dive in to a few of the most exciting findings about abandoned cart flows specifically.
Abandoned cart flows drive the highest RPR and the most conversions
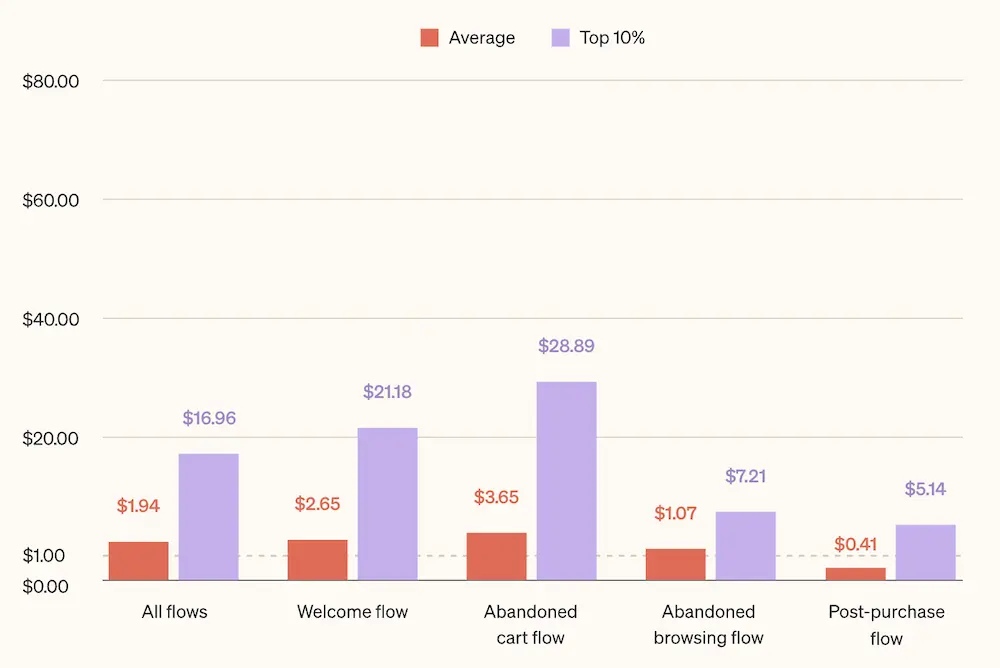
If you’re looking for a single flow to set up to drive revenue, you’ll find it in the abandoned cart series: Abandoned cart flows drive the highest average RPR ($3.65) and the highest average placed order rate, or conversion rate (3.33%), of all flows.
- Average abandoned cart flow RPR: $3.65 (37.74% higher than the second-highest RPR flow, the welcome flow)
- Top-performing 10% abandoned cart flow RPR: $28.89 (36.40% higher than the second-highest RPR flow, the welcome flow)
These rates are attractive even at their average, but some industries have even more exciting abandoned cart results.
The automotive and hardware & home improvement industries, for example, report an average abandoned cart RPR close to $10, while the home & garden and electronics industries bring in around $6 per recipient, on average.
For the top-performing 10% of brands, abandoned cart flow RPR is even more impressive:
- Top-performing 10% of hardware & home improvement brands: $75.66
- Top-performing 10% of electronics brands: $66.89
- Top-performing 10% of home & garden brands: $64.52
- Top-performing 10% of automotive brands: $52.35
This is good news across industries, as it shows high abandoned cart flow RPR on both items people need, like furniture, as well as leisure and luxury items, like fancy tech gadgets.
Abandoned cart flows have the least disparity between the median and top 10% of brands
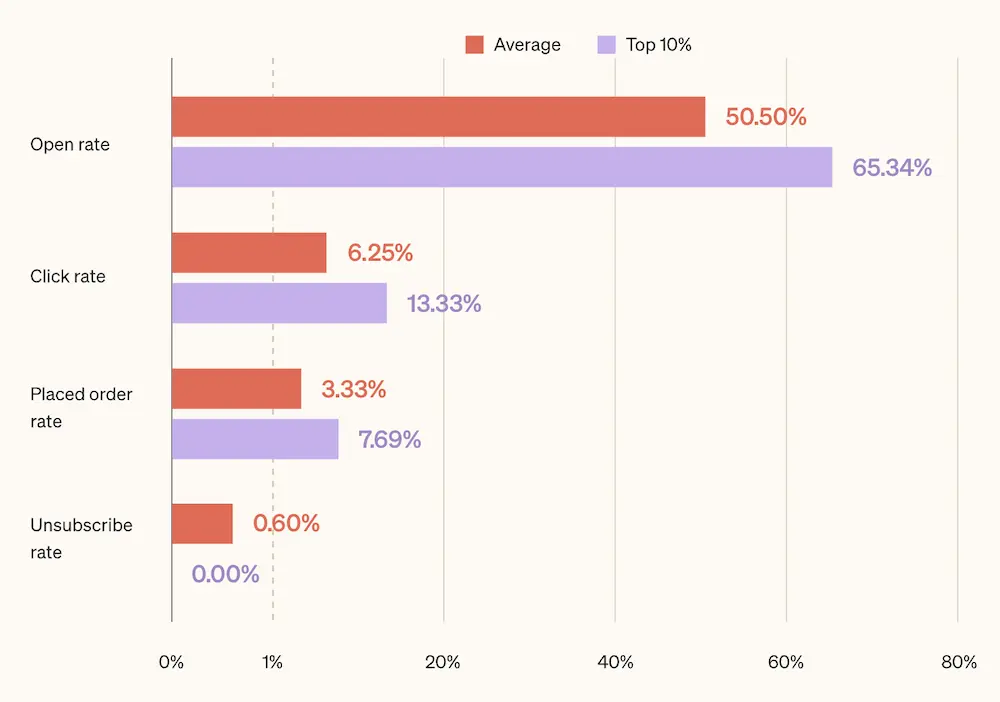
Compared to other flows, abandoned cart flow metrics show the least disparity between the average brand and the top-performing 10% of brands.
This may tell us that few abandoned cart flows diverge from the standard—and it may also signal that you can’t go wrong with even a basic abandoned cart flow.
- Abandoned cart flow open rate
- Average:50.5%
- Top 10%:65.34%
- Abandoned cart flow click rate
- Average: 6.25%
- Top 10%: 13.33%
- Abandoned cart flow placed order (conversion) rate
- Average: 3.33%
- Top 10%:7.69%
- Abandoned cart flow unsubscribe rate
- Average: 0.60%
- Top 10%: 0.00%
Abandoned cart emails drive high engagement across ecommerce industries
Across all of the ecommerce industries we analyzed, the abandoned cart flow consistently drove high engagement—suggesting that no matter what industry you’re operating in, an abandoned cart is an absolute must.
- The food & beverage industry drove the highest average open rate for abandoned cart flows at 52.16%, with an above-average click rate of 6.63% and an above-average conversion rate of 3.66%.
- The sporting goods industry also clocked above-average metrics across the board, with a 51.69% average open rate, 6.95% average click rate, and 3.50% average conversion rate.
- Average abandoned cart flow click rate for the apparel & accessories industry was exactly even with the all-industry average at 6.25%, but both open rate and conversion rate were slightly above average at 51.43% and 3.42%, respectively.
- While the office supplies and specialty industries reported below-average open and click rates, conversion rates were also above average for these businesses, at 3.45% and 3.36%, respectively.
Why are those numbers so strong? Simple: customers who add products to their cart demonstrate a high intent to purchase.
Key takeaways to measure and optimize your abandoned cart performance
While every brand is different, performance metrics like these will help you gauge whether your abandoned cart flow is knocking it out of the park, doing fine as is, or needs some work to improve.
Once you understand what kind of benchmarks your abandoned cart flow could achieve in an ideal world, you’ll be better equipped to track and measure your flow’s performance so that you can start answering questions like:
The answer depends on your industry, product line, and business goals, but a common sequence might involve 3 emails: a simple reminder after 2-4 hours, a follow-up with a discount after 24 hours, and a final message after 48 hours that includes alternative product recommendations or asks for feedback.
Again, this depends, but a good place to start is personalizing your subject line by including the recipient’s first name and details about the products they left behind in their cart.
Not necessarily. While discounts are a strong incentive for encouraging shoppers to complete a purchase, they can also work against you by training shoppers to wait for a discount before buying. Consider segmenting high-value carts and only offering an incentive on those where you stand to make more revenue from a single purchase.
The best way to answer these questions for your brand? “Test, test, test,” says Tim Akers, founder of Akers Digital. “The ability to A/B test flows is critical. Test out different offers and the timing of the sequence to see what version works best for your brand.”
In Klaviyo, you can set up both automatic and manual A/B testing for flows to compare variables like:
- Message frequency
- Send time
- Time delays between messages
- Subject lines
- Copy
- Images
- …and more
“It’s an iterative process where we’re continuing to review how things are performing and then taking an educated guess and saying, ‘OK, we think if we tweak this specific thing, that it’s going to move this specific needle,’” says Sean Donahue, director of email marketing at nationally recognized digital marketing agency Power Digital.
Then, Donahue adds, “we make that change, see what happens, and just continue that process over and over again.”
Related content
- Abandoned cart emails: 12 best practices with examples
- What is an abandoned cart email? Their importance, function, and basic components
- How to create an abandoned cart flow in Klaviyo